How to Use the Symbol ATM Straddle Performance History
The Symbol ATM Straddle Performance History is designed to help you compare at-the-money option straddle
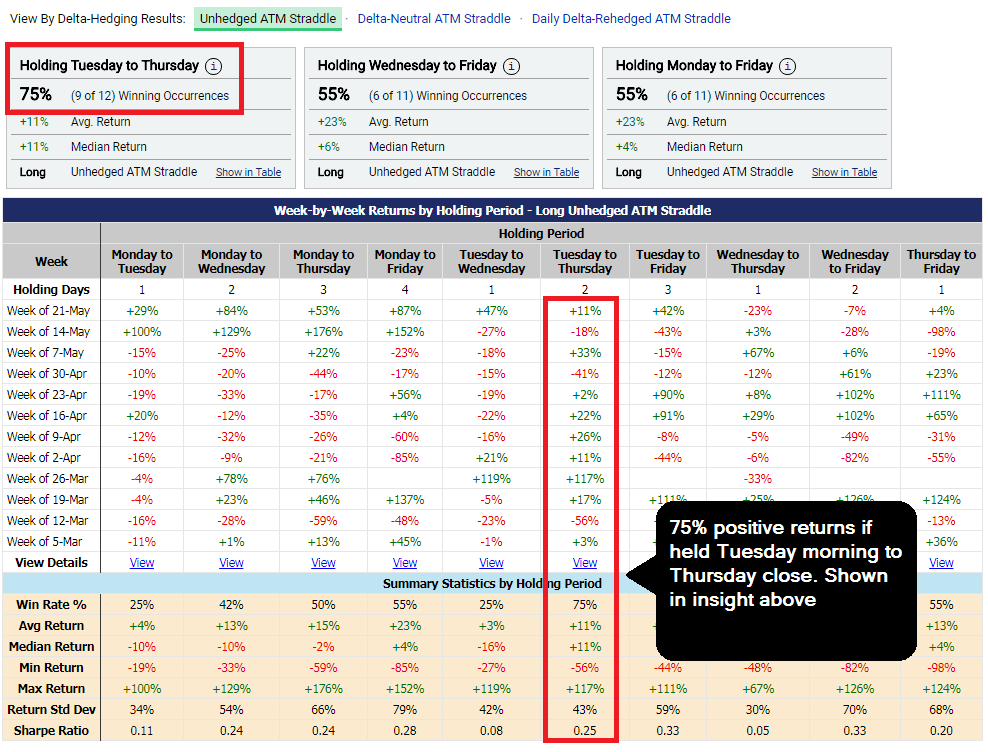
results for multiple different holding periods, on a week-by-week basis. Each symbol shows up to the last
12 weeks of ATM straddle returns, for a range of different holding periods -- like Monday-to-Tuesday, Monday-to-Friday,
Tuesday-to-Wednesday, etc.
Ideally a trader would use the analysis to enhance their options trading research and
help generate ideas for positions to take on at-the-money option straddles.
The report is fully functional for both Premium Total Access and Options Trader subscribers.
How To Find It
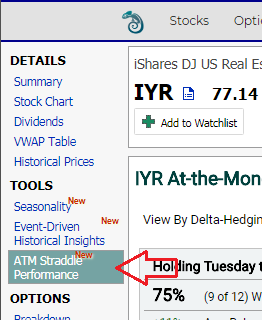
When you're viewing a symbol's overview page, there is a menu item to the left hand side called ATM Straddle Performance, listed under Tools

Methodology
The report deals directly with at-the-money option straddles. If you are not familiar with straddles, you can learn about them here .
At a base level, the report tries to answer the question: If I bought a straddle on a certain day of the week and held it until the close of a different
day, how often would that straddle gain value?
To do this, what we do is sort through millions of option market snapshots to find the value of option straddles at the open
of each week day (typically about 30 minutes after the open to allow the markets to tighten with trading). Then, we track the
value of those straddles as they reach the close of each day of the week. Each holding period in the analysis has a start day
and an end day -- so if you're looking at Monday-to-Tuesday holding, that would be "opening" on Monday morning and "closing" on
Tuesday afternoon. If the straddle gains value over that time frame, that would be considered a "win" for that period.
The analysis shows you which holding periods have the highest "win" rates over the course of the last 12 weeks (if available).
If there are exchange holidays on either the start date or the end date, or if the market is too wide to produce an accurate
calculation of the value, we will skip the analysis for that observation. We want to focus in on useful observations, where the bid and ask
of the options is tight enough to determine a realistic market value for the straddle.
Delta-Hedging Techniques
An important concept that goes hand-in-hand with option trading is delta-hedging. To learn more about delta, visit this page.
To learn more extensively about delta-neutral trading, visit this page.
Unhedged ATM Straddle is a naked option straddle, 1 call and 1 put on the same at-the-money strike, with no additional stock traded.
The resultant value is based solely on the value of the options themselves. Any net delta made from the trade is left untouched.
Delta-Neutral ATM Straddle is based on hedging the straddle's initial net delta to neutral, and then leaving the trade untouched
for the remainder of the week.
Daily Delta-Rehedging is based on hedging the net delta both initially at the "opening" of the trade, and then daily at the end of each
day to neutralize the delta.
For techniques that include delta-hedging, the straddle return and the win rate would both be affected by the gain or loss in value of the
underlying stock that results from hedging.
Below is a screenshot of where you can toggle between these choices on the report.

Explanation of Results

-
% Win Rate: the number of times (out of the available observations) that the theoretical straddle trade gained value.
When viewing delta-hedged results, the win rate would be impacted by the gain or loss in the trading of
underlying stock associated with the hedging
-
Avg. Return: each observation results in a net return on the straddle for that week. We calculate the return in percentage terms,
i.e. +10% or -25% for that week. Then, we take all of the returns over the observation set and get an average for the span
-
Median Return: the same as the average return, except it is the median value of all the observation returns.
Sometimes averages can be skewed significantly by one or two extreme results. Using both average and median return helps to narrow the result set
-
Return Std Dev: the standard deviation of that symbol's returns within the set of available observations.
The lower the standard deviation, the more consistent
the results are
-
Minimum Return: the lowest, or worst, return within the set of available observations.
It doesn't always have to be negative if all of the results were positive
-
Maximium Return: the highest, or best, return within the set of available observations.
It doesn't always have to be positive if all of the results were negative
-
Sharpe Ratio: a value which indicates the average return divided by the standard deviation. A high, positive Sharpe Ratio would
show that the average return is relatively high and the deviation in the results is relatively low -- suggesting a consistently
well-performing straddle
View Detailed Week-by-Week Analysis
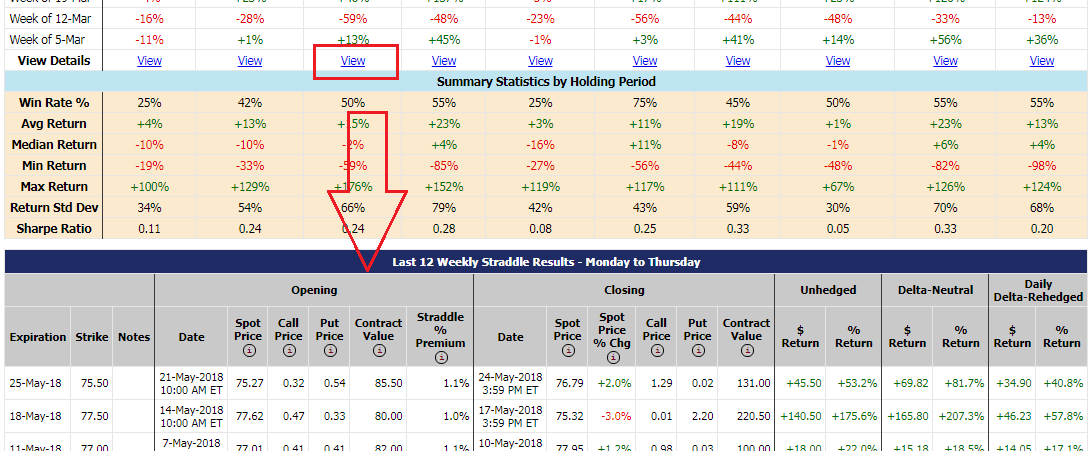
To view a more detailed breakdown of week-by-week results for one particular holding period, click on the link that says View
in the column for that holding period. At the bottom of the page you'll see another table with the details of each week's start
values and end values, with more specific results than the summary table above.
This table shows you the Expiration and Strike for the specified straddle, and compares the "Opening" values
to the "Closing" values. You can see Notes, which would indicated whether there was an earnings date sometime within the week
specified. Towards the right of the table you'll see the different returns based on the available hedging techniques used.
$ Return shows the raw return in the strategy based on dollars (the theoretical trade assumes the purchase of 1 long call and 1 long put),
while the % Return shows that value in terms of percentage of initial straddle cost.


