At-the-Money Options Straddle Screener
The At-the-Money Straddle Screener enables users to filter and cross-compare at-the-money option straddles from
thousands of expirations for the options-listing symbols on the market. You can see current market prices and theoretical values
for the straddles as if you were intending to buy or sell them, as well as view those values side by side with
historical volatility data, potential catalyst events, and a Historical Price Return Distribution (more on that below).
How to Find It
The screener is listed under the Screeners menu item at the top of the screen, where it says For Premium Users -- Non-Directional (Volatility).
How to Use It
Generally speaking, the at-the-money (ATM) straddle will be a strike nearest to the current underlying stock price, both buying or selling
one call and one put on that strike for the same expiration. (To learn more about straddles themselves,
visit our Straddle Help page .)
This screener shows you dozens of columns of data, split up into several tabs that run across the top: Summary, Events, Historical Distribution,
Volatility, and Risk.

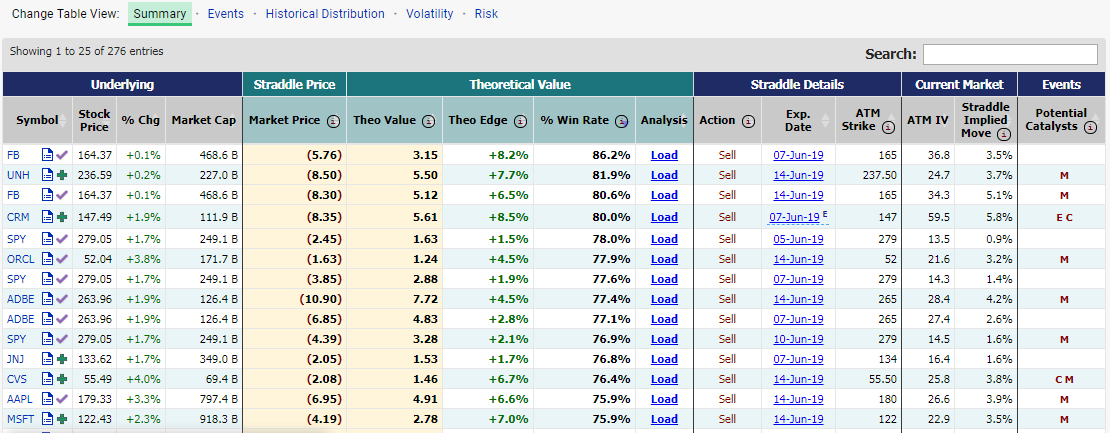
Summary gives you the key information you need off the bat -- which symbol, expiration, strike, action (buy or sell), market price, and theoretical value.
Additionally, Summary has a list of potential catalysts that are occurrring between now and the expiration date, like earnings dates, dividends, company events,
and market-wide economic events (such as Federal Reserve FOMC Meetings, Housing Reports, and Employment Situation).
Events tells you the next upcoming earnings date and next upcoming dividend date for the symbol.
Historical Distribution compares the current market price and straddle implied move with the historical price changes over intervals that cover the
same length of time. Because you can profit from straddles if the stock moves either up or down, the historical price changes are displayed as absolute
values -- the magnitude of the move, in either direction. See the Theoretical Value section for more.
Volatility shows the expiration's current at-the-money implied volatility (ATM IV) and straddle implied move against the historical volatility for the
underlying over the past 20 days and past 1 year.
Risk displays the breakeven stock prices for the straddle, both to the downside and to the upside, and also shows you the amount at risk if you were to be
selling the straddle. (When you buy a straddle, the amount at risk is the amount paid -- the biggest loss is for the straddle to become worthless. When you sell,
you are risking the stock moving a very large amount in either direction. We show you what the loss would be if the stock were to hit extreme changes, based on
the historical observations.)
At the top of the page you'll see the Filters, most of which correspond to the result statistics in the table. The other filters are descriptive,
like In My Watchlist, which selects only those symbols listed in your Custom Watchlists, or
In ETF, which selects only those stocks which are currently listed as holdings in selected popular market ETFs (like SPY, DIA and QQQ).
Under the Expiration filter, you can select a particular expiration from the list of dates, or you can group them all by selecting Next 7 Days,
Next 14 Days, Next 30 Days, or Next 60 Days. The longer the timeframe you're selecting, the more results there will be (and therefore it might
take a second longer to load the table).
The screenshot below shows a sample of the filters available:

Explaining the Historical Distribution and Theoretical Value
The Historical Distribution and Theoretical Value are tied together in this analysis -- the distribution is what drives the
calculation of the theoretical value. It's best to explain by running through an example.
Let's say IBM has an expiration in 10 days (10 trading days, not 10 calendar days). We know the current market price of an IBM at-the-money
straddle, but we want to know if buying it is a good deal (or, if selling it is a good deal). Historically, how has IBM's underlying price moved
over 10-day increments? That's where the historical distribution comes into play.
We take the last 2 or 4 or 6 years (depending on the filter you have selected, 4 is the default) and split them up into 10-day intervals.
We find all of the price changes for those 10-day intervals. For example, a 4-year period typically has 100 separate 10-day intervals. For each
interval, we find the change in the underlying price, and we calculate the theoretical payout for the current straddle if the stock were to move
that same amount over the next 10 days. Let's say one period the stock moved up 5%. So we say, if the stock is currently $100 and the strike
is currently $100, and the stock were to move up 5% over the next 10 days, the stock price would be $105 and the straddle would be worth $5. (At a
stock price of $105, the $100 Call is worth $5 and the $100 Put is worthless.)
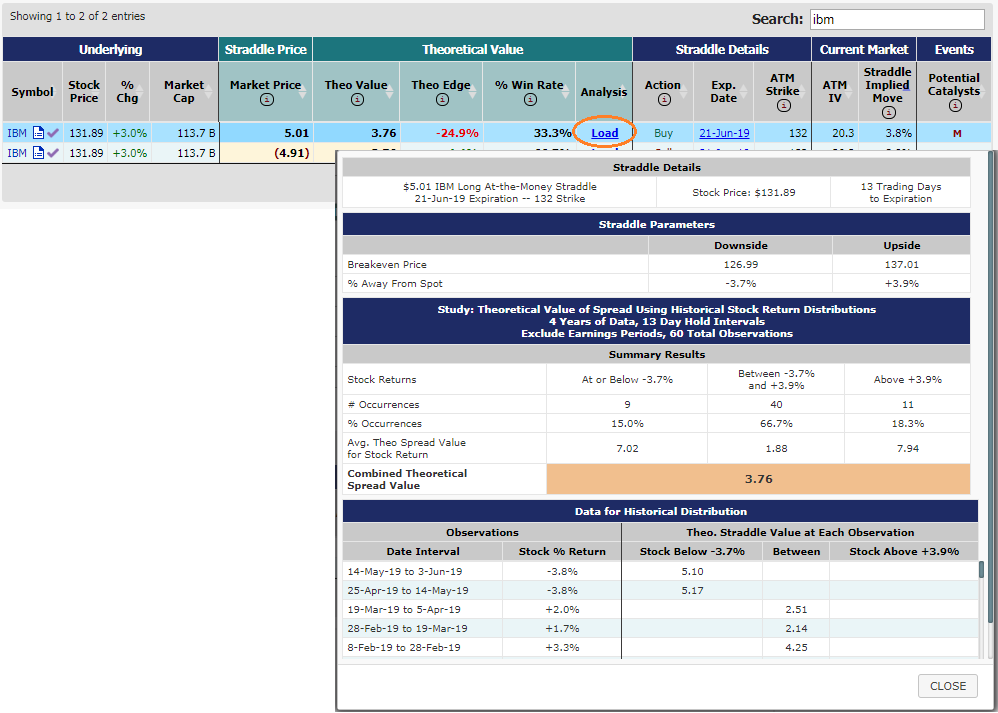
We repeat this process for every 10-day period within our historical distribution, and arrive with an average straddle value in the end. That's the
Theoretical Value that you see on the report. You can compare the Theoretical Value with the Current Market Price, which gives you
the Theoretical Edge -- that is, based on this historical analysis, how far is the theoretical value away from the current price. The Win Rate
column represents the number of times, based on historical observations, that buying (or selling, whichever is selected) the straddle at the current
market price would have resulted in a net positive gain by expiration.
Note: if we know that the symbol has an earnings date between now and expiration, then we will only use historical intervals that include an earnings date.
If we know that it does not have earnings, we will only include intervals that do not have earnings dates within them. This is because earnings periods tend to have
much larger moves (in either direction), which skew the results of the analysis.
To see a breakdown of all of these values, you can click on the Load Analysis link on the Summary tab of the table.

Table Results
Here's a screenshot of a sample result set from this screener, with the Summary tab selected:


