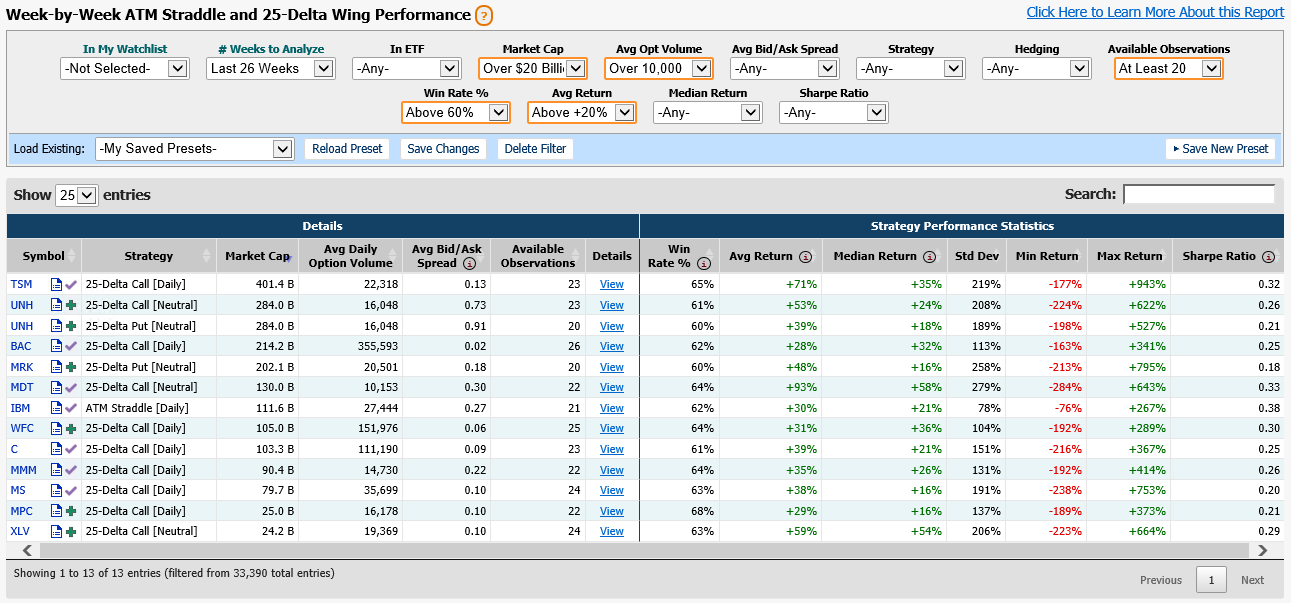
Our goal with this report is to analyze what would happen if you could buy the front-month at-the-money straddle (ATM Straddle) at the beginning of the week and hold it until the end of the week. Then, what if you did that each week? How would the performance of that option strategy work when done repeatedly?
We find the straddle nearest to at-the-money for each symbol's expiration that is closest to the end of the week. (In many cases, symbols have weekly expirations that expire every Friday, so those would be selected.) Then we track the value of the straddle from the opening of the week (typically 10:00 AM ET on Monday morning) until the close of the week (4:00 PM ET Friday). This report makes the assumption that we would be long 1 straddle (1 call and 1 put), so a "win" would be if the value of the straddle goes up over the course of the week.
Additionally, we have expanded the report to compare the performance of long 25-delta calls and long 25-delta puts for the same expirations over the same time periods (buying at the start of the week and closing out at the end of the week).
You can compare against different forms of delta-hedging option strategies:
Unhedged is based on solely the value of the options. If there is a net delta on the strategy, it leaves that delta untouched
Delta-Neutral is based on hedging the delta to neutral at the opening of the strategy, and then not hedging again after that
Daily Delta-Rehedging is based on hedging the delta to neutral first at the opening, and then each day throughout the week at the close of the day
To learn more about Delta-Neutral Trading, check out the MarketChameleon Learn Section.
You can use the filters at the top of the page to narrow down your selections. The filter for Number of Weeks to Analyze will change the report from showing you a range of choices from the most recent 26 weeks to the most recent 1 week, with values in between. The averages and win rates on the table will be based on those weeks only.
Click on the "View" link for more precise details on the individual results for the strategy selected. The detailed results will appear at the bottom of the page.
▲ Close
In ETF
Market Cap
Avg Opt Volume
Avg Bid/Ask Spread
Strategy
Hedging
Available Observations
Win Rate %
Avg Return
Median Return
Sharpe Ratio
The goal of the Week-by-Week Option Straddle and Wing Performance report is to answer the question: Which symbols have had consistent at-the-money straddle performance on a week-by-week basis?
The report is based on the concept of buying 1 at-the-money straddle (1 call, 1 put) for the nearest expiration, starting each Monday morning and holding until market close on Friday
You can analyze results for up to the last 12 weeks or 26 weeks, or over shorter time periods, like 1-, 2-, 3-, or 6-week ranges
The results provide the Win Rate (a "win" would be considered an increase in value over the week), Average Return, Median Return, and Minimum and Maximum Return over that timeframe
In addition to at-the-money straddles, we also analyze the performance of simple long 25-delta call or long 25-delta put strategies over the same time frame, using the same conditions.
So, you can compare, was taking a risk on a big move for an out-of-the-money option more valuable in the long run than simply buying the straddle?
Buying and selling these strategies can incorporate several different hedging techniques, so we wanted to provide the ability for the user to see results from different methods
Unhedged is simply buying the strategy long. The net return at the end is based on the ending value of the options against the original value (the cost to buy the strategy). No hedging is done
Delta-Neutral is buying the strategy long and hedging the net delta to neutral at the initial observation. The return is based on the total change in value of both the strategy and whatever shares of stock are necessary to neutralize the initial delta
Daily Delta Re-hedging is similar to the above delta-neutral technique, but in addition, the net delta is hedged to neutral at the end of each day
By clicking the "View" link under the "Details" column, you can see the results week-by-week for a single symbol
It might point out outliers, like earnings dates, that could impact the averages seen in the main report
Or, you can confirm the consistency of a certain symbol's strategy performance by seeing the data that goes into the calculated results
Single-symbol breakdown appears at the bottom of the page
