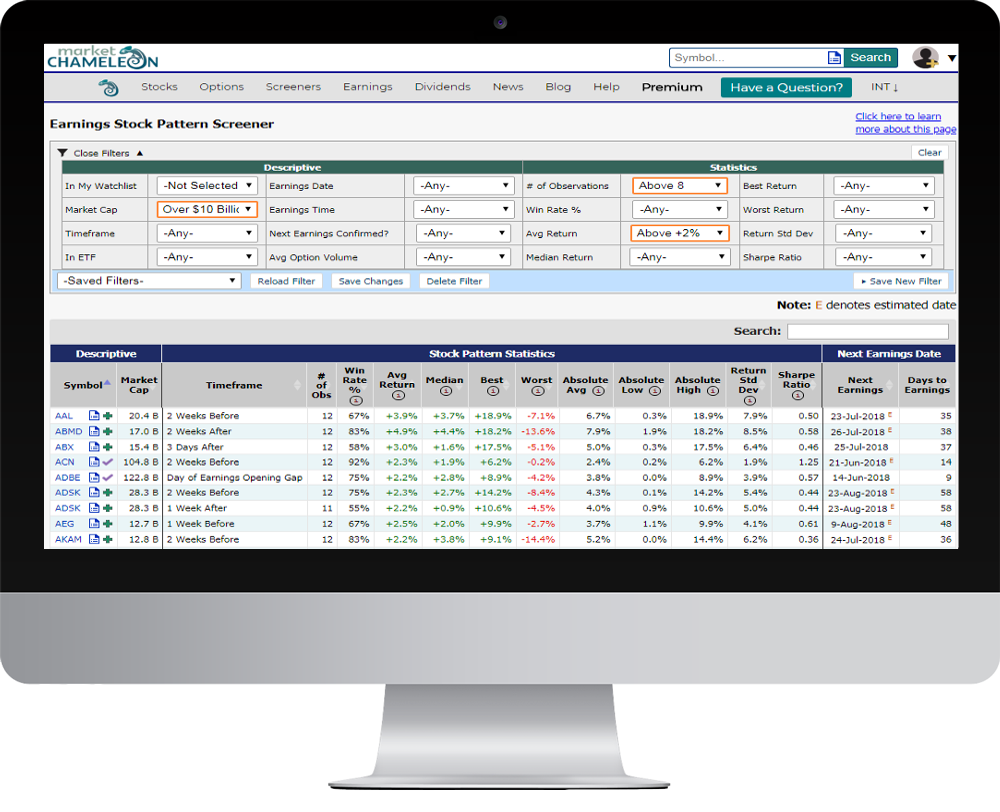
Screen more than 3,500 symbols for stock price performance around earnings. Find if there are patterns in price behavior before, during, or after earnings over the last 3 years. Includes average return, best and worst return, and several timeframes to choose from. Learn More
Watch the quick video about this feature.
