Seasonality Screener By Calendar Month
How to find it?
From the main menu go to Stocks > Seasonality Screener By Calendar Month (or Click Here)
How to use it?
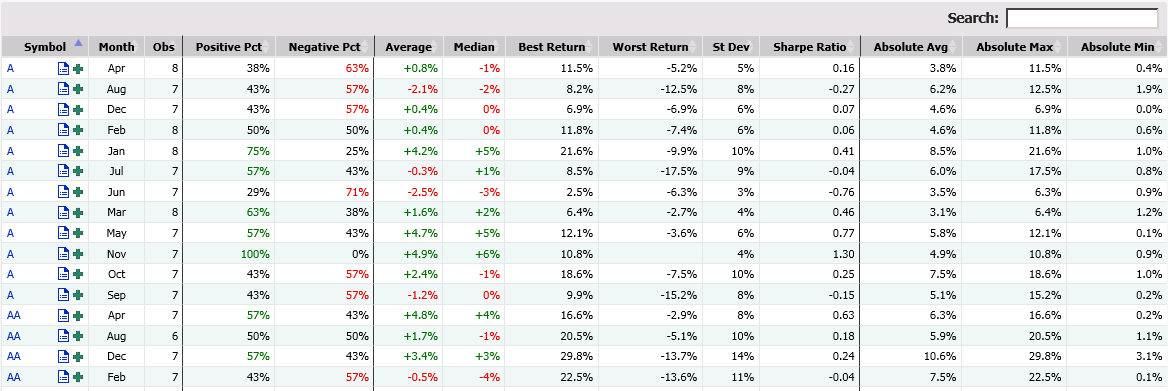
Scan the entire list of stocks for seasonality patterns by calendar month. Find out which calendar month had the best win rates, average returns and median returns. You can use the results to gauge seasonal volatility by the most and least volatile holding periods and quickly compare seasonality betweens different stocks.
This screener allows you to filter, sort and search by seasonal price returns by calendar month.
The screenshot below is an example of the results you would see in the Seasonality Screener By Calendar Month.
The screenshot below shows the available filters for the seasonality screener. You can use the filters of the seasonality screener to further narrow down your results.
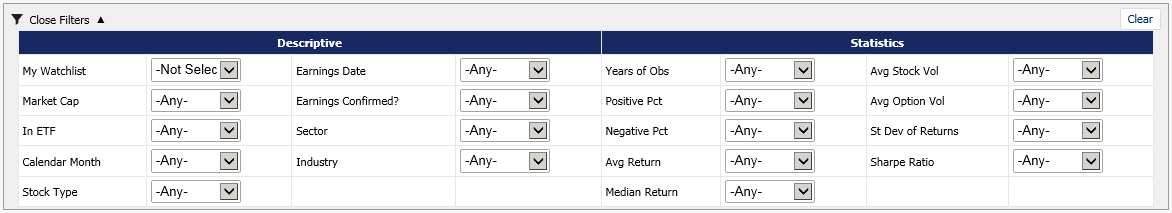
- In My Watchlist - Use this dropdown to filter the results by your favorite stocks that you have saved to your personal watchlist.
- Market Cap - This filter will allow you to find the the stocks that are above or below a certain market cap threshold.
- In ETF - This filter will allow you to find the the stocks that are holdings within the selected ETF (e.g. if you select SPY - S&P 500, the results will only show stocks that are within the S&P 500 holdings).
- Calendar Month - This will allow you to filter based on a specific calendar month of the year.
- Stock Type - This will allow you to filter based on the type of stock (e.g. common, ETF, REIT, Closed End Fund, etc.).
- Earnings Date - You can filter the report based on weather a stock is going to announce earnings within a certain amount of days.
- Earnings Confirmed? - This filter simply allows you to narrow down the results to the stocks that have confirmed the next earnigns announcement date.
- Sector - Filter the results based on which sector a stock belongs.
- Industry - Filter the results based on which industry a stock belongs.
- Years of Obs - Filter the results based on the number of years of observations.
- Positive Pct - This will allow you to filter the results based on the number of times a stock had a positive return for a particular calendar month (as a percentage of the total observations for that calendar month).
- Negative Pct - This will allow you to filter the results based on the number of times a stock had a negative return for a particular calendar month (as a percentage of the total observations for that calendar month).
- Avg Return - This will allow you to filter by the average stock return for any given calendar month.
- Median Return - This will allow you to filter by the median stock return for any given calendar month.
- Avg Stock Vol - This filter allows you to narrow down the results based on the 90 day average stock volume for a stock.
- Avg Option Vol - This filter allows you to narrow down the results based on the 90 day average option volume for a stock.
- St Dev of Returns - This filter will allow you to search by the standard deviation of a particular calendar month stock return (e.g. the standard deviation of the stock return for the month of Janurary for the last 10 years).
- Sharpe Ratio - This filter will allow you to narrow down the results based on the sharpe ratio (i.e. the average return divided by the standard deviation).
