This Order Imbalance History is a summary of the market-on-close order imbalances for all stocks, listed by day. Market-on-close order imbalance information is disseminated by exchanges starting 15 minutes before the market closes. The history is broken down into total and net notional amount for both buy and sell imbalance orders. The 20-Day chart shows the last 20 individual trading days, while the One Year chart shows a 20-day moving average of the net order imbalance for the last year. The Max Timeframe chart shows the results for all the dates we have available.
Use the filters below to narrow the results onto stocks in your watchlist, stocks that are held in certain ETFs, or with certain Stock Type or Market Cap.
▲ Close

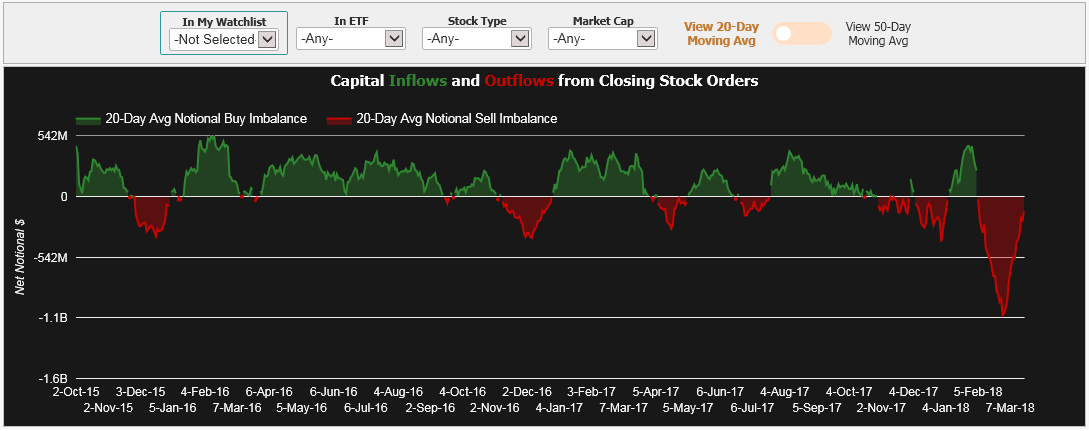
Stock order imbalances from market-on-close can provide insight into longer-term inflows/outflows of capital in the market
Certain institutional funds must trade on closing price (ex. mutual funds, hedge funds, ETFs) and base their redemption/creation units on closing net asset value (NAV)
Imbalances from market-on-close orders can give an indication if investors are pulling money out of those funds (and out of the market, in general), or committing more capital
A regular market should see a steady stream of inflows from pension funds and investors, but a large influx or large outflow can indicate a change in sentiment