Earnings Option Strategy Screener
The goal of the Earnings Option Strategy Screener is to enable users to research an expansive set of data
on how past earnings releases have affected the value of options in the marketplace.
How to Find It
The screener is listed on the main menu under the Earnings heading, where it says For Premium Users
How to Use It
The screener lists all symbols that have released quarterly earnings and that have listed options during those earnings announcements.
All of the strategy results in the table are based on buying the options long and holding them over the specified timeframe.
You can sort and filter the results in the table to narrow in on strategies you might be interested in:
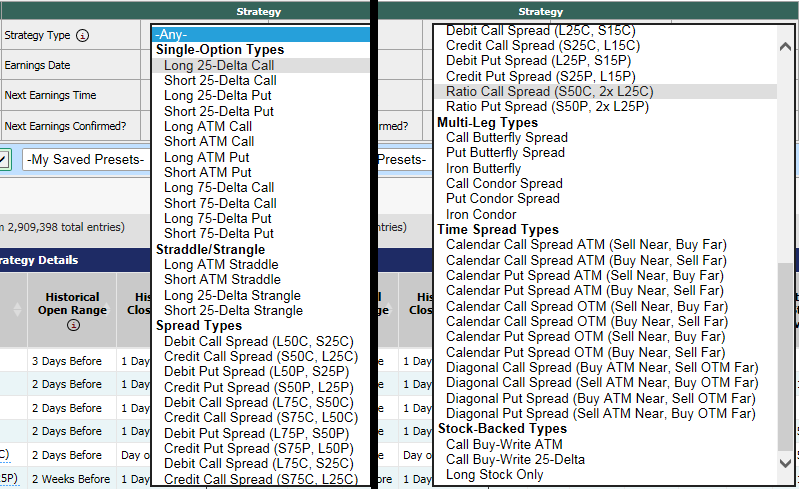
Available Strategies

-
25-Delta Call is one single out-of-the-money option call for the nearest expiration to the end of the selected timeframe. We use
a snapshot of the call's market value at the beginning of the timeframe and compare it to the call's market value at the end of the timeframe.
You can see how often over the last 12 earnings (at most 12 earnings) the 25-delta call has gained value over the course of the selected
timeframe near earnings. Typically, a stock would need to experience significant gains in price to result in a large gain in 25-delta call value
around earnings.
-
ATM Call and 75-Delta Call strategies are also available. You can compare how well the strategy would have performed if you had sold
the call options short, or if you had bought them long in the selected timeframes around earnings.
-
25-Delta Put is similar to the call, but with one out-of-the-money put. In this case, if the stock price experiences significant losses,
it would likely result in large gains for the 25-delta put.
-
ATM Put and 75-Delta Put strategies are available to see how at-the-money or in-the-money puts performed over the last
-
ATM Straddle is one at-the-money straddle (1 call option, 1 put option) for the nearest expiration to the end of the selected timeframe.
Often, straddles price in a great deal of volatility premium in the days leading into earnings. The change in straddle value around earnings
is based on both a change in the stock price and a change in the symbol's volatility. A stock that does not move very much around earnings
could experience low volatility, which would significantly decrease the value of the straddle after earnings.
-
25-Delta Strangle is a method of either buying or selling the 25-delta call AND the 25-delta put for the same expiration. When selling, the
trader expects the options to expire valueless, with the stock price being between the strikes. That way the trader receives the net proceeds of the
sale as income. Buying the strategy long would suggest the trader expects the stock price to either rise or fall dramatically, so that either the
call or the put expires in-the-money.
-
Call Spreads (vertical call spreads) are buying a call for one strike in an expiration and selling a call on a different strike for the same
expiration. Our screener provides several different types of call spreads -- ATM/25-Delta, ATM/75-Delta, 25-Delta/75-Delta, 25-Delta/15-Delta. In addition,
you can compare between credit call spreads (where you are taking in a net proceed from the trade) and debit call spreads (where you are paying out a net cost
for the trade).
-
Put Spreads cover the same concepts as the call spreads, but executing the strategy with put options.
-
Ratio Spreads are 2-by-1 call or put spreads where the trader will sell the at-the-money strike and buy 2 times the number of contracts
for an out-of-the-money (25-delta) strike.
-
Butterfly Spreads are multi-leg strategies that involve selling 2 at-the-money calls (or puts) and then buying 1 in-the-money strike and
1 out-of-the-money strike. If the stock expires close to the at-the-money strike, this strategy can return great profits. If the stock goes up or
down a great deal and ends up beyond either of the outside strikes, it could result in large losses, but the losses are capped at a maximum value.
-
The Iron Butterfly is a multi-leg strategy that combines calls and puts into one strategy -- selling an at-the-money call and an at-the-money put,
and then buying the out-of-the-money strikes for each type. The benefit is that you're selling at-the-money strikes that have a great deal of premium,
but buying the wings that come at a low premium cost.
-
Condor Spreads are similar to the Butterfly in that they are multi-leg spreads, but they involve combining an out-of-the-money spread with an in-the-money
spread, and they can be executed with either calls or puts on the same expiration. The goal would be a low-volatility environment where the options
expire towards the center of all the strikes.
-
Iron Condor spreads combine an out-of-the-money call spread and an out-of-the-money put spread into one strategy. It has a similar payout structure to
the condor spreads above.
-
Buy-Writes are strategies backed by the underlying stock, where a trader will sell a call option (typically out-of-the-money) and buy stock
(or is already long stock). If the option expires out-of-the-money, the trader will have received the proceeds of the sale as income. If the option
expires in-the-money, whatever losses there would be offset by the gain in stock price of the underlying stock. We track both an ATM Buy-Write
and a 25-Delta Buy-Write.
-
Calendar Spreads are time spreads that are focused on two separate expirations -- one near-term and the other further out (referred to as Far).
The ATM Calendar Spread is selling the near at-the-money option and buying the far at-the-money option (though we do track the reverse as well,
buying near and selling far). Those will usually be on the same strike. The OTM Calendar Spread focuses on the 25-delta strike for each option
type, and won't always be on the same strike price, as the 25-delta in one expiration is likely different from the 25-delta in the next.
-
Diagonal Spreads are different forms of the calendar spread which involve buying (or selling) the near at-the-money strike and selling (or buying)
the far out-of-the-money (25-delta) strike.
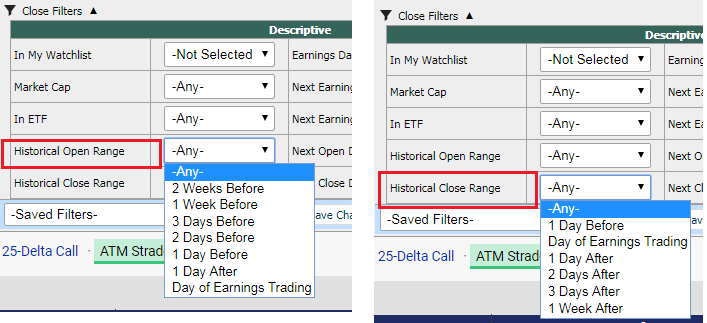
Explaining the Timeframes

For the purposes of this report, the Day of Earnings Trading is considered to be the day immediately following the release of the earnings.
So, if a stock were to release earnings on Monday morning before the open (BMO), then Monday would be the day of earnings trading (and similarly, Friday
would be the day before earnings trading).
If a stock releases earnings results Monday after the close, then Tuesday would be considered the day of earnings trading, and Monday would be
the day before earnings.
Before Timeframe Choices: You can select any of 2 Weeks Before, 1 Week Before, 3 Days Before, 2 Days Before, or 1 Day Before earnings.
The option value snapshots would be taken at the end of the selected day.
Day of Earnings Trading: the option value snapshot is taken at the end of the day immediately following earnings trading.
After Timeframe Choices: You can select any of 1 Day After, 2 Days After, 3 Days After, 1 Week After, or 2 Weeks After earnings.
The option value snapshots would be taken at the end of the selected day.
An example: if symbol ABCD announces earnings on Thursday May 10th, after the market close, then the day of earnings trading would be Friday May 11th, the next day.
Selecting a timeframe of 3 Days Before to Day of Earnings would mean you're comparing the option value from the end of Tuesday May 8th to
the end of Friday May 11th. If you selected 1 Day Before to 1 Week After, you'd be comparing the value from the end of Thursday May 10th to
the end of Friday May 18th.
Explaining the Results
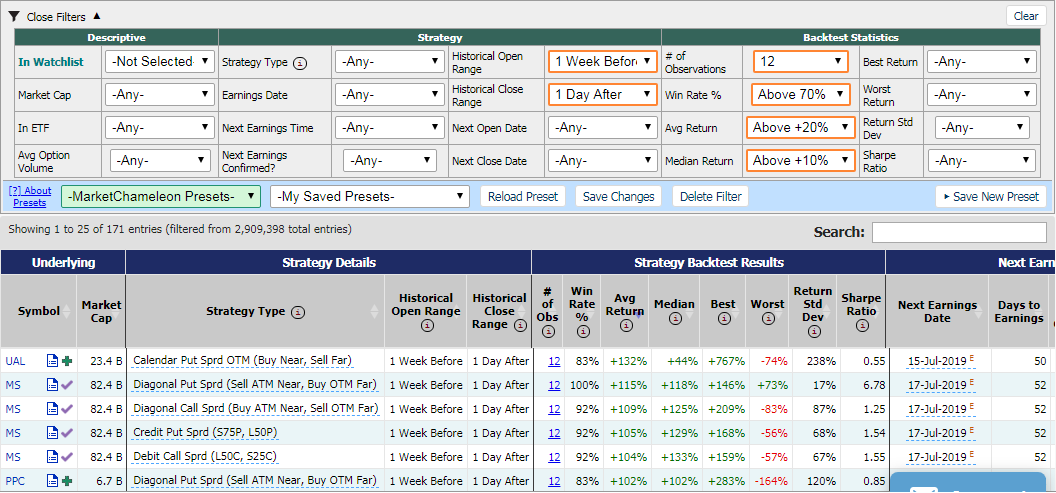
The results table is loaded with information. Here's a quick rundown of the results available -- many of which are filterable.

-
Days to Earnings is the number of trading days until the next earnings date, whether estimated or confirmed.
-
Days to Open is the number of trading days until the date representing the opening range for the selected timeframe. If there are 45 days
until earnings and you are looking at an open range of 2 Days Before Earnings, this number will be 43.
-
Days to Close is the number of trading days until the date representing the closing range for that timeframe. If there are 45 days until earnings
and you are looking at a close range of 2 Days After Earnings, this number will be 47.
-
# of Observations is the number of historical earnings events where we have found applicable data for this options analysis.
Note: you can click the link in the observation column to view a breakdown of historical results for that symbol and strategy.
-
Win Rate % is the number of times, out of those observations, that the selected strategy gained value over the specified timeframe.
-
Avg Return is the average percentage return for the strategy over the specified timeframe.
-
Median Return is the median percentage return for the strategy over the specified timeframe. Using the median return can help counteract
average returns that are skewed by 1 or 2 extreme results.
-
Best Return is the best return, percentage-wise, for that strategy over the specified timeframe. If all the returns are negative, the
best return would be the negative value of the lowest magnitude.
-
Worst Return is the worst return, percentage-wise, for that strategy over the specified timeframe. If all the returns are positive, the
worst return would be the lowest positive return.
-
Return Std Dev is the standard deviation of all the percentage returns within the observation set.
-
Sharpe Ratio is a figure which represents the average return divided by the standard deviation. A high, positive Sharpe Ratio would be
considered to be a positive indicator -- high average returns with low standard deviations.
Take a look at the screenshot below with a sample result set from this screener:


